
Software tools for testing Wi-Fi can run on a laptop, but dedicated hardware tools offer the convenience of a sometimes less cumbersome form-factor that are compact enough to fit in the pouch of a laptop bag.
This article looks at five of these devices: AirCheck G2 Wireless Tester (NETSCOUT), Cape Networks Sensor, EyeQ Wi-Fi Monitor (7SIGNAL), NetBeez Wi-Fi Monitor and WiFi Pineapple Tetra.
+Also see: REVIEW: Mojo wireless intrusion prevention system; 8 Free Wi-Fi Stumbling tools+
The AirCheck G2 Wireless Tester is a tool that would be useful for any network pro that deals with Wi-Fi installs or troubleshooting regularly and prefers not to toot along their laptop to get measurements. It’s a solid custom-made Wi-Fi stumbler and analyzer with a simple ethernet tester built-in.
The WiFi Pineapple Tetra is a one-of-a-kind penetration or ethical hacking tool for wireless-based attacks. It’s certainly for those pen testers out there, but can also be great for those that just like to geek out or get some hands-on Wi-Fi security experience.
The three Wi-Fi sensor solutions we reviewed all have their own pros and cons:
The Cape Networks solution has the best GUI and sports some good advanced functionality, but requires that you purchase and deploy their hardware sensor, of which there is currently only one model offered.
The EyeQ platform offers two different hardware sensors and also allows you to deploy sensor software onto your existing computers and mobile devices, but it’s lacking when it comes to the GUI and advanced functionality.
The NetBeez solution also allows both hardware and software based sensor deployment with some great advanced functionality, and even supports wired monitoring. But their hardware has more of a home-made look and feel and software deployment is limited to GNU/Linux machines and devices.
AirCheck G2 Wireless Tester
The AirCheck G2 Wireless Tester is a handheld Wi-Fi stumbler, troubleshooting and performance testing tool by NETSCOUT. Although the tester is available a la carte, they sent the kit (model number AIRCHECK-G2-TA-KT), which adds an external directional antenna for better assistance in locating Wi-Fi devices and a test accessory that plugs into the wired network to act as iPerf server for performance testing over the Wi-Fi. The kit sells for $3,095 on Amazon.
 NETSCOUT
We reviewed the AirCheck G2 kit that includes the directional antenna and iPerf test accessory.
AirCheck G2 Wireless Tester has a rugged plastic case, measuring about 8 inches high, 3 1/2 inches wide, and 2 inches deep. On the left side, you’ll find an Ethernet port for running tests on wired connections. On the right side, you’ll find two USB ports for optionally connecting flash drives to save/transfer the captured data. There’s also one micro-USB port for connecting the unit to a computer to utilize the AirCheck G2 Manager software to configure profiles and view or export reports of the saved data. Also on the right of the unit is an RP-SMA connector for connecting external antennas. The unit also comes with a custom protective carrying case, which provides a convenient strap on the back to secure in your hand and a spot to slide in the external antenna when needed.
We reviewed the AirCheck G2 Wireless Tester with the hardware version 2 and software version 2.0.0.1635. On the main screen, you’ll find shortcuts to the main tools:
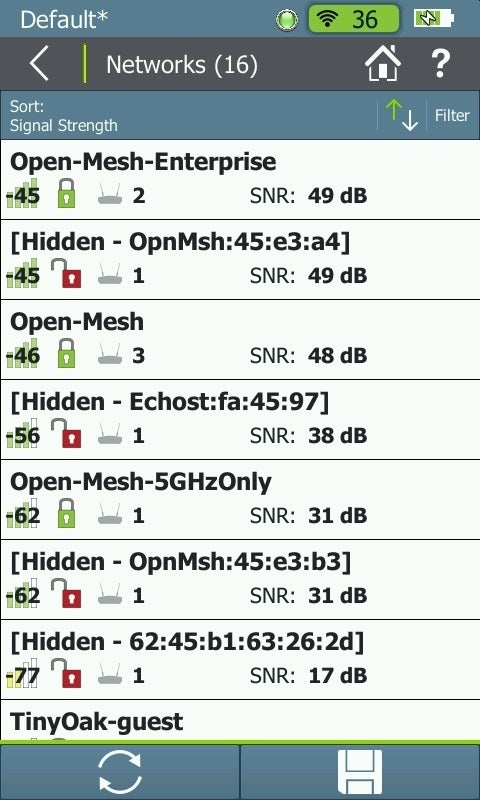
Networks: Groups APs by the same SSID and gives the channel, signal in negative dBm, and SNR values for the closest AP. You can tap on a network to view further details, including a list of all APs with that same SSID, the exact noise level in negative dBm, and the number and listing of clients connected. Although the unit does detect signals that have SSID broadcasting disabled, it unfortunately doesn’t reveal the actual SSID.
 Eric Geier
The Networks screen shows the different networks and their basic details; you can tap one to view further details.
Channels: Displays channel utilization and overlap graphs for 2.4 and 5GHz bands. The graphs are useful, but we didn’t like being forced to turn the unit in landscape orientation to view the overlap graphs.
 Eric Geier
The Channel Overlap graph, which must be viewed in landscape orientation.
Access Points: Lists similar details as the Networks screen, but shows all SSIDs (listed by the MAC addresses) individually instead of grouping same SSIDs as a Network.
Clients: Lists all detected Wi-Fi devices with their details, including their signal level, channel and connected AP. Tapping on a client displays further wireless details.
Interferers: Lists any non-Wi-Fi device that’s causing interference in the 2.4 or 5GHz bands.
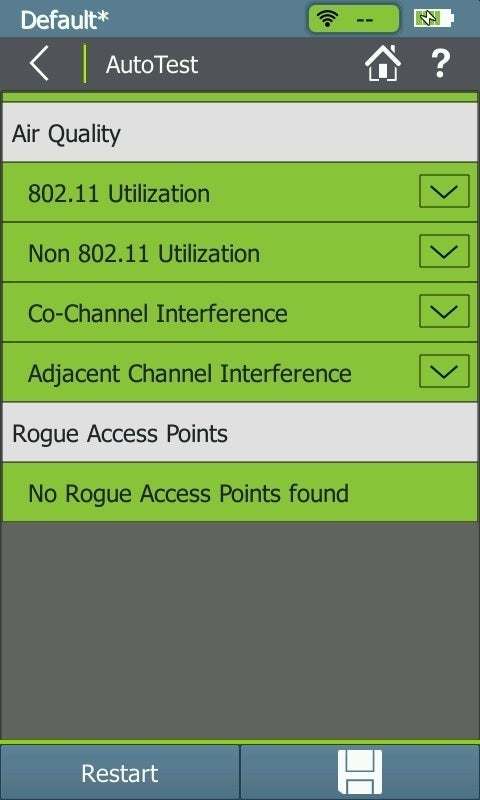
AutoTest: Runs automated air quality tests and looks for rogue access points. As it states before performing the test, it refreshes the captured data when you do this, so you must save your session beforehand if you want to save the prior captured data. Of course, it would be nice if you didn’t have to worry about this.
 Eric Geier
Results of an AutoTest, which gives you feedback on a few utilization and interference parameters.
Ethernet Test: Runs a test on any Ethernet connection you have plugged into the unit. It looks for PoE ability, link data rate, switch port and VLAN details, IP via DHCP, default gateway, and a successful ping to Google (or other IP you have preconfigured).
If you connect to a network via the Network or Access Point tool, it performs an automated set of tests, similar to the Ethernet Test. On the results screen, you can also access the roaming and iPerf test tools. The iPerf tests can be performed against the Test Accessory when plugged into the network or against another iPerf server you setup on the network.
 Eric Geier
Results of a wireless connection test, shown after connecting to a network.
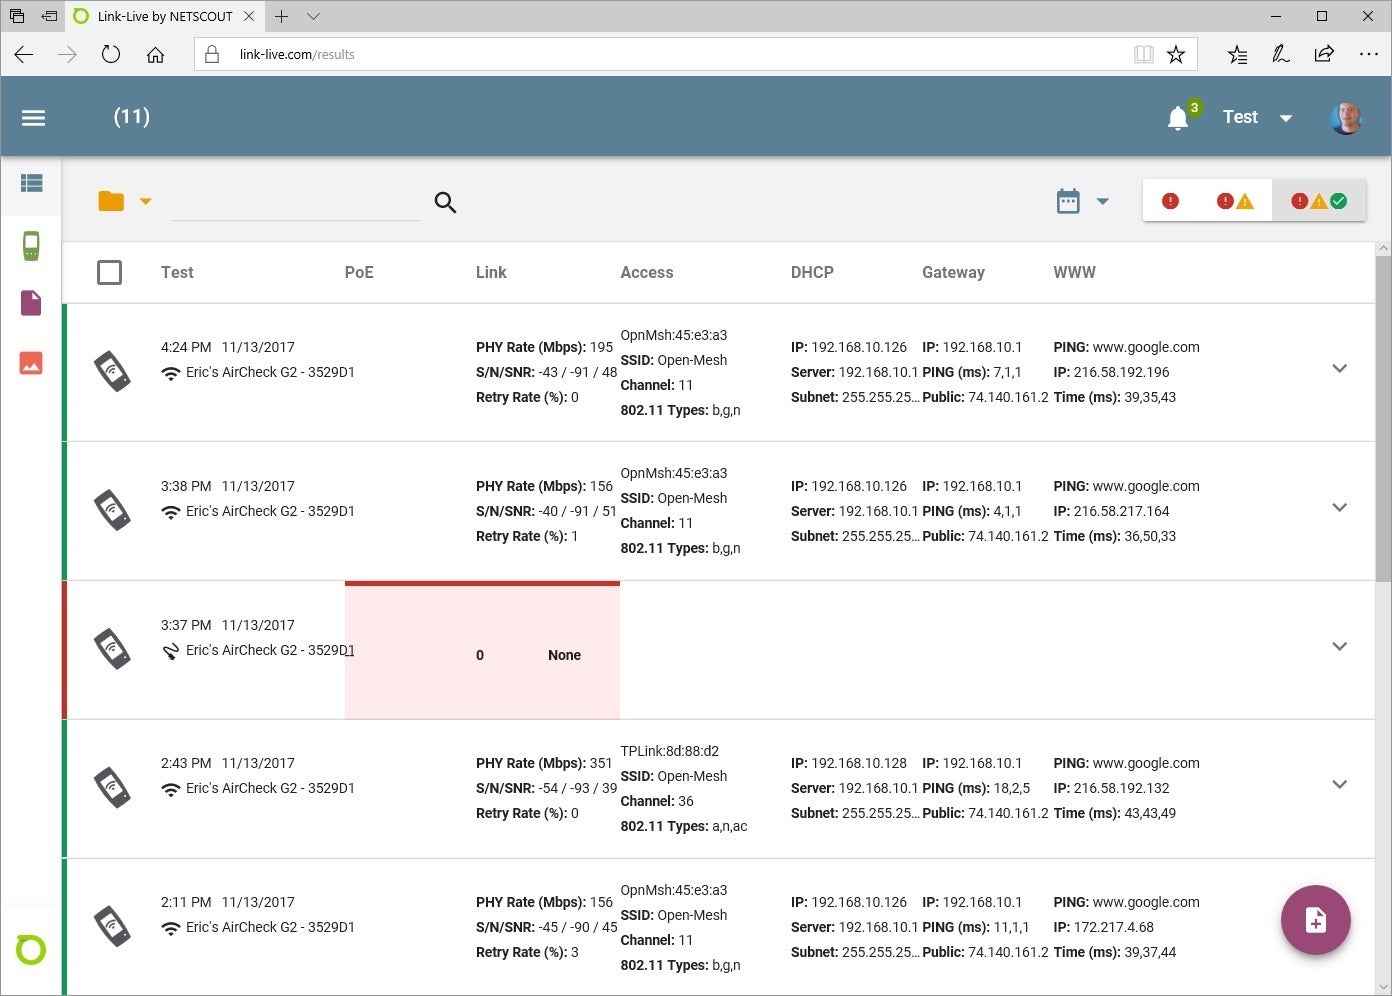
The AirCheck G2 Wireless Tester supports the Link-Live Cloud Service. Once you setup a free account and claim the unit, the results of wireless and wired connection tests are automatically emailed to you and uploaded to the cloud service. This can be convenient, but the other captured data (like the network, access point, and client lists and iPerf tests) isn’t supported.
 Eric Geier
Viewing the wireless and wired test results via the cloud service.
However, NETSCOUT does provide the Windows-based AirCheck G2 Manager software that can get all the captured data and screenshots, and also generate reports, configured profiles and manage the device.
 Eric Geier
The AirCheck G2 Manager software allows you to view saved data from the unit.
Overall, the AirCheck G2 Wireless Tester is a solid Wi-Fi testing tool, although the price is a bit steep. It has a user-friendly and intuitive GUI. Good sorting and filtering is provided for most of the data. On most screens, you can tap the question mark to see a description of the data or settings you’re currently viewing. The only times we referred to the PDF documentation was for how to perform the iPerf throughput tests with the Test Accessory and how to save screenshots. The iPerf test tool is buried on the wireless connection screen that you only see after connecting to a network. Saving screenshots turned out to be an easy long tap on the question mark icon.
Cape Networks Sensor
The Cape Networks Sensor is an access point looking sensor that you can deploy multiples of throughout a Wi-Fi network for remote monitoring and troubleshooting via their free cloud-based dashboard. Currently, there’s only one type of sensor offered by Cape Networks, and it’s pricing isn’t publicly disclosed.
 Cape Networks
The Cape Networks Sensor has a clean AP look and feel and comes with mounting hardware.
The sensor unit is cased in a while plastic covering with exposed black vents around the sides. The unit measures about 6 inch square and 1.6 inches high. Along with the sensor unit, you receive mounting hardware, a power supply in case you don’t have PoE, and a quick start guide with tips and tricks on mounting and deploying the sensors.
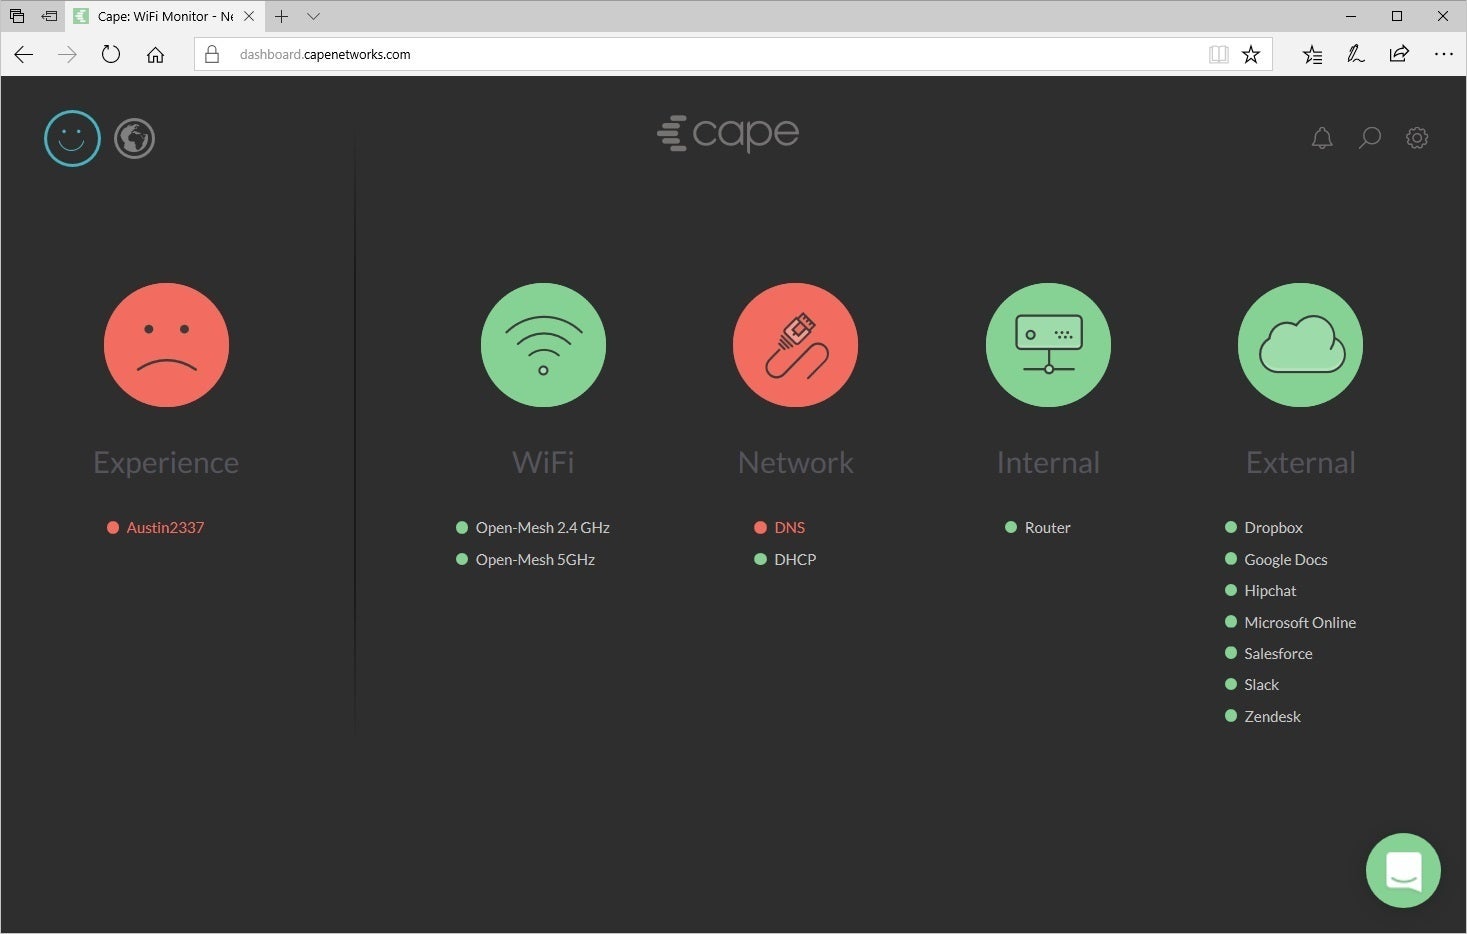
The first time you login to the cloud GUI, you accept their EULA, ensure the sensor(s) are detected, configure the SSID to connect to and add additional users. After that, you’re greeted with a very simple dashboard with five different monitoring categories with with statuses that are green when all good and red when issues are detected:
 Eric Geier
The Cape Networks Dashboard when there’s an issue detected.
Experience: Represents the overall user experience, so will likely be red if any issues are detected. Under this category, all the sensors are listed.
Wi-Fi: Wi-Fi connectivity and quality based off of thresholds, for instance the default bitrate warning is 20 Mbps or less and the error alert is 6 Mbps or less.
Network: DHCP and DNS availability and response times based off of thresholds. For instancethe default high DHCP response warning is 5 seconds or more and error alert is 10 seconds or more.
Internal: Any TCP/UDP servers or devices, such as captive portals or printers on the local network that you manually add via port or ICMP ping monitoring. Availability, latency, packet loss, and (optionally) jitter are monitored. Alerts are based off of thresholds as well. For instance, the default high-latency warning is 500 ms or more and error alert is 1000 ms or more.
External: Similar monitoring capabilities, parameters and thresholds as Internal, but these are for services and devices outside the sensor’s local LAN. There are a couple of external sites that are monitored by default and a couple more that are pre-configured but not enabled. You can manually add other sites as well.
Hovering over each monitoring category displays more info. Clicking a device, network, or service will bring up its page with more info, including graphs for the monitoring parameters. You can conveniently hover over the time-lapsed graphs to see the date/time and even select a certain range to zoom into so you can analyze a certain date/time better. However, you can’t easily export the graphs.
Under the Experience category, you can click on each sensor to view further details. Here we found some neat features. You can view a list of all SSIDs detected by the sensor, which comes in handy when analyzing channel usage. You can retrieve a packet capture (PCAP) file for advanced analysis. You can also generate a report, but is just a raw dump of the collected data. It would be better if the report was more visually appealing.
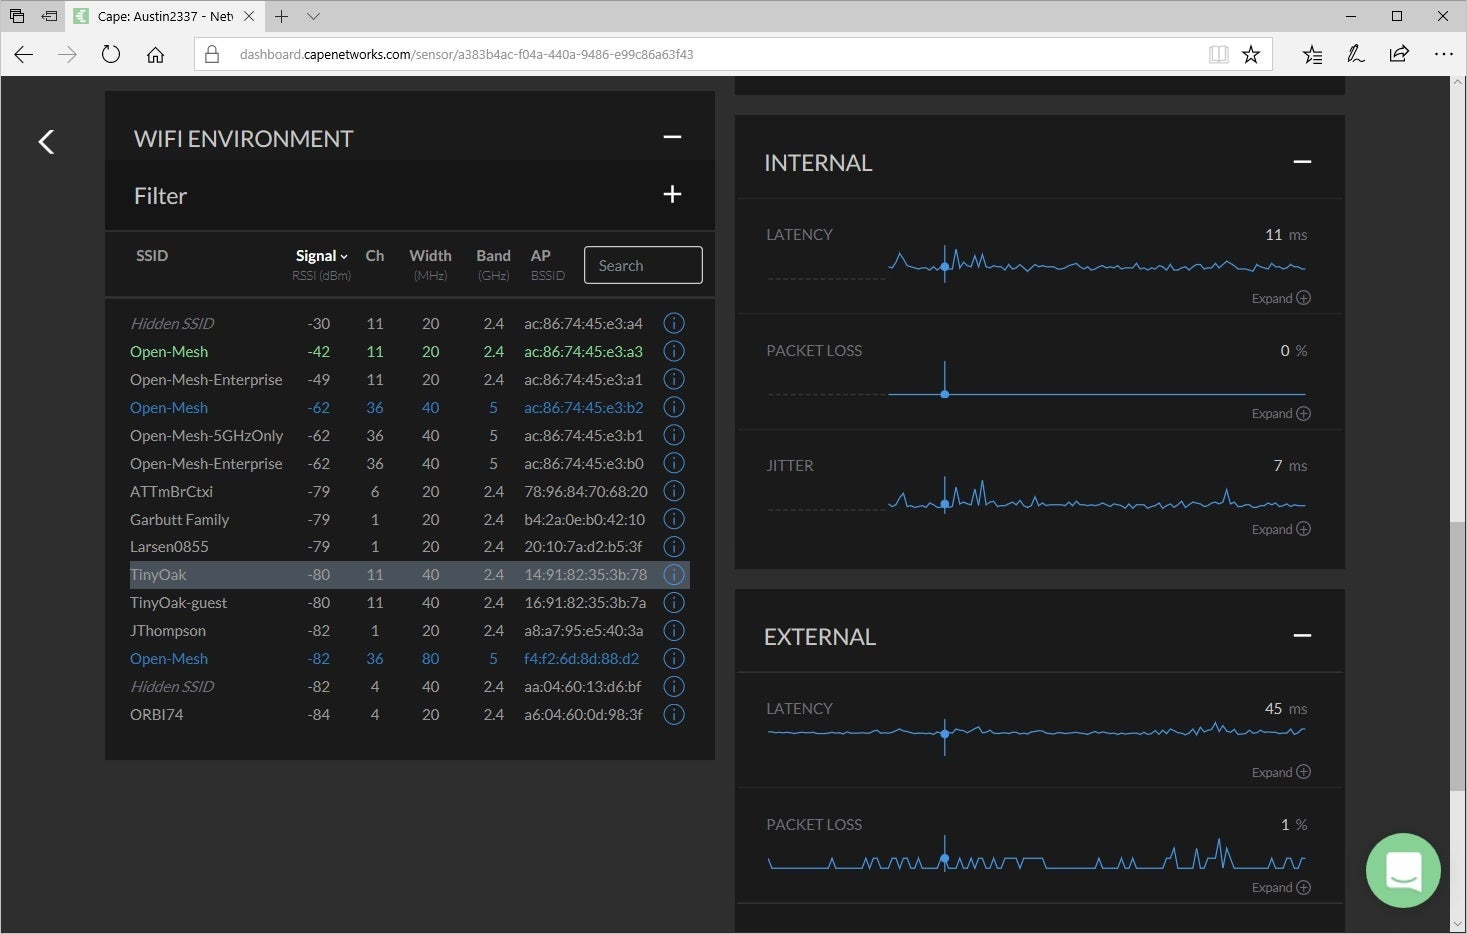 Eric Geier
On a Sensor’s page you can view a list of all SSIDs detected by the sensor, useful when analyzing channel usage.
Clicking on the gear icon in the upper-right brings up the Settings page. There you can configure the sensors, Wi-Fi, testing, thresholds, alerts and users. In the sensor settings, we finally discovered you can enable multiple SSID testing for a sensor. It’s a great feature, but would be nice to know about ir earlier on when connecting to the SSIDs.
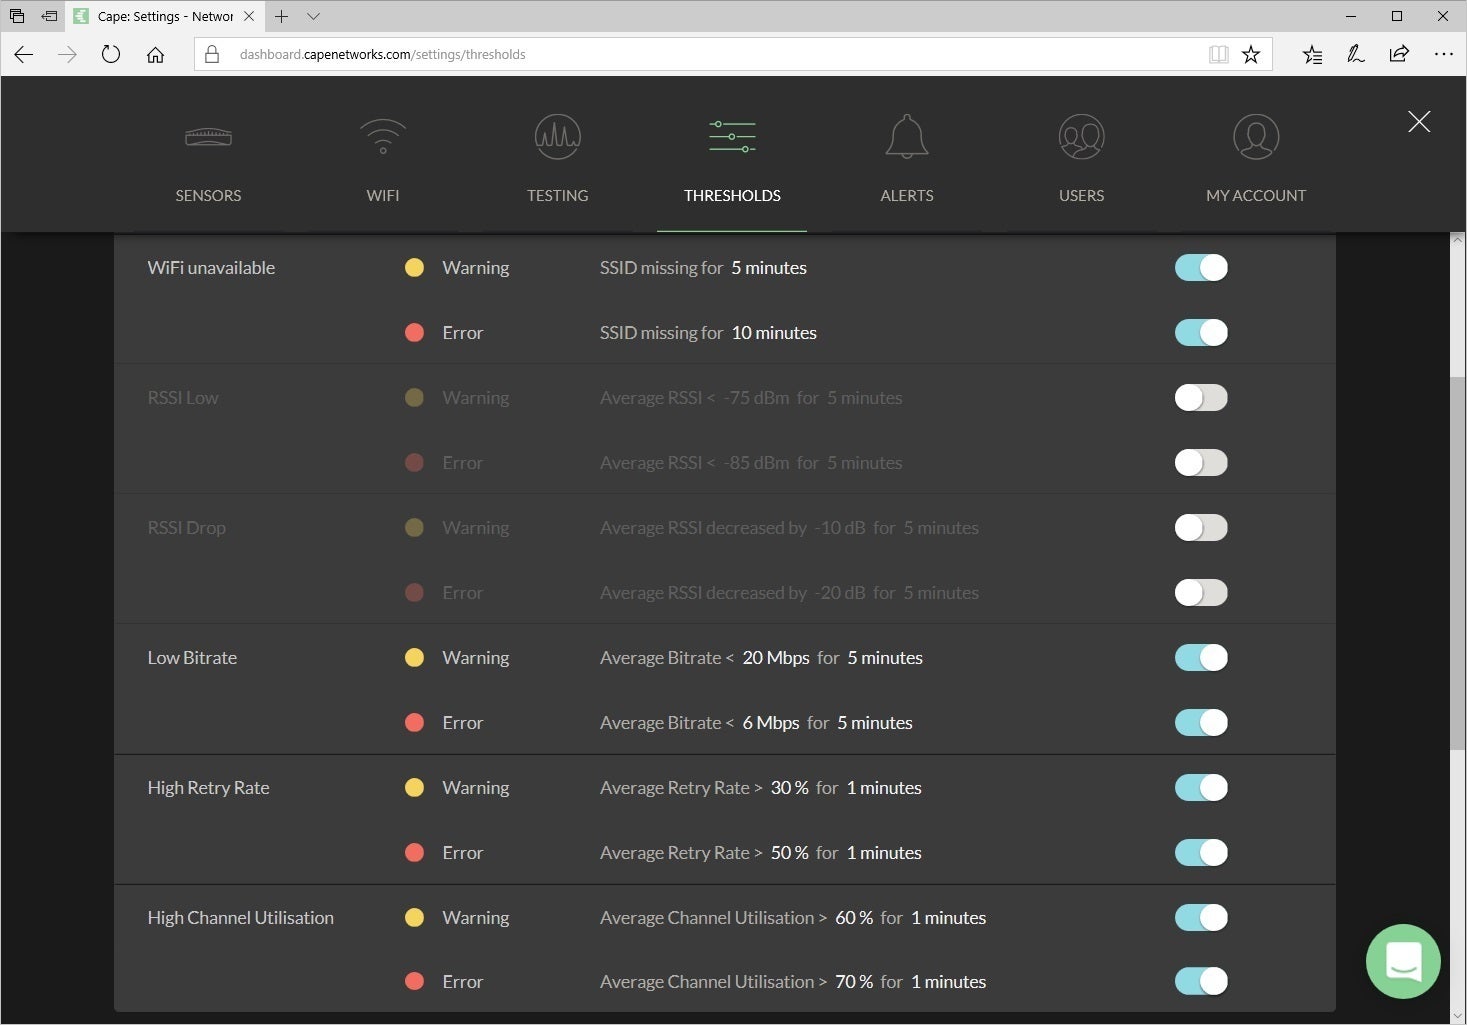 Eric Geier
Example of the Wi-Fi warning and error alert thresholds.
Overall, we found the Cape Networks Sensor to be a solid Wi-Fi monitoring device with some advanced features, like a backup mobile Internet connection. The GUI has a simple look and feel while still offering advanced functionality. We didn’t find any on-screen documentation or help, but their integrated chat-based support seemed very responsive.
EyeQ Wi-Fi Monitor
The EyeQ monitoring platform from 7SIGNAL is another cloud-based service targeted towards Wi-Fi performance. The Wi-Fi monitoring can be done via one of their two hardware sensors or via their software-based sensors on Windows and Mac machines, or even Android and iOS devices. In our review, we evaluated the EyeQ platform using Windows and Android deployment. Pricing starts at $33 per device per year with the possibility of volume discounts.
 Eric Geier
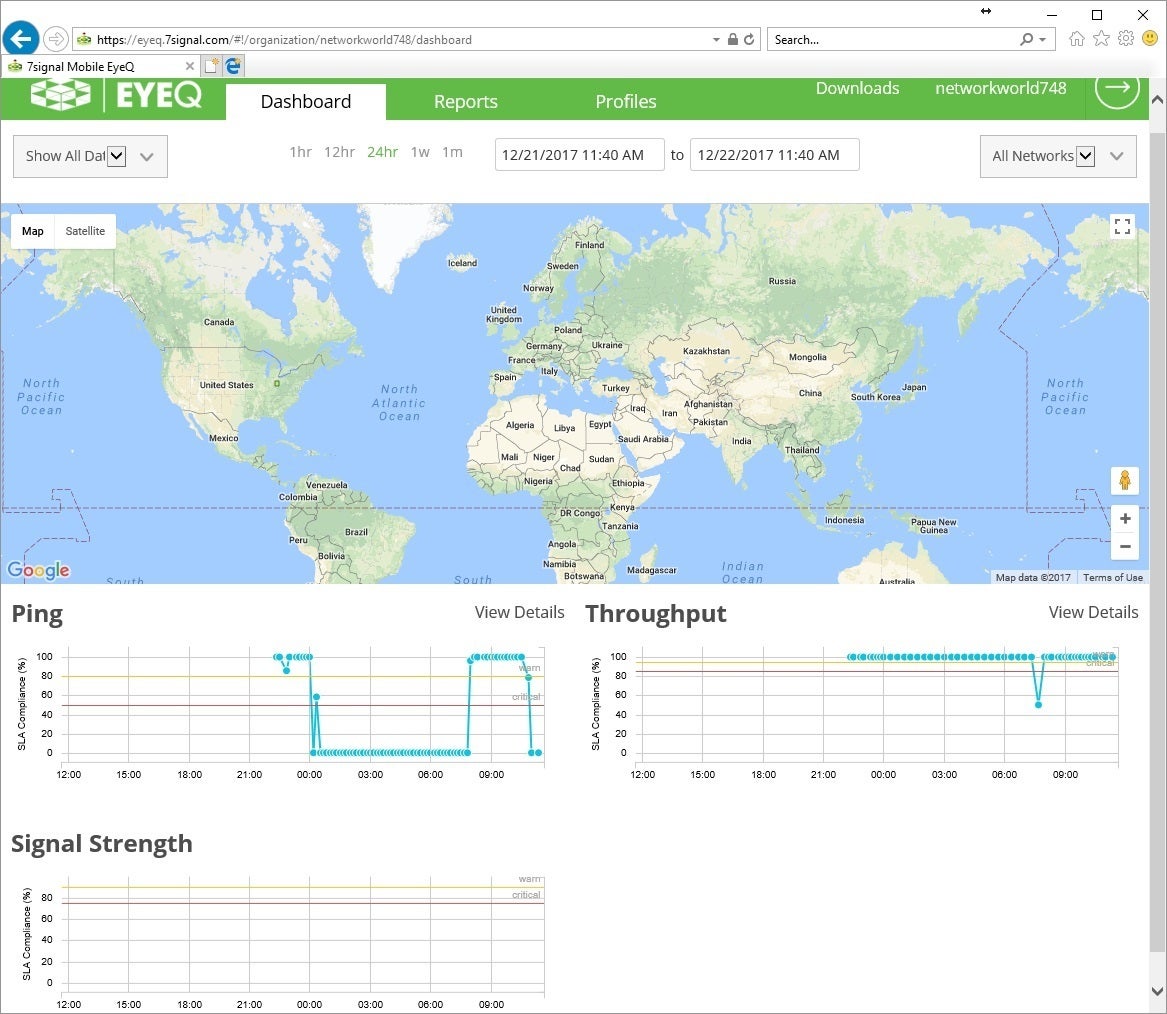
The EyeQ Dashboard gives you a quick overview of the sensor locations and stats.
When installing their sensor software on computers and mobile devices, you must configure the app with your Organization ID so it connects to your account. After logging into the web GUI, you see the Dashboard, showing a map of the estimated locations of the sensors along with graphs for ping, throughput and signal strength. You can filter the data shown and specify the timeframe. You can also click to view more details for the ping and throughput data. That takes you to what looks like a different page but you must click their Back link (which isn’t all that noticeable at first) instead of the browser’s Back button or it will take you back to the sign-in page.
 Eric Geier
The Ping graph detail page shows EyeQ comes preconfigured to ping against the most popular websites.
On the Reports page, you can view throughput results based upon client platform and the top 10 and bottom 10 clients for download and upload throughput. You’ll see the results shown in a table format with data like the AP and channel the clients were connected through and the client’s signal strength. This data can help you analyze and troubleshoot the Wi-Fi, but we think there could be more data given (such as throughput based upon time of day, or new data altogether like retry rates and roaming times), in different formats such as graphs, and exportable, like with a PDF.
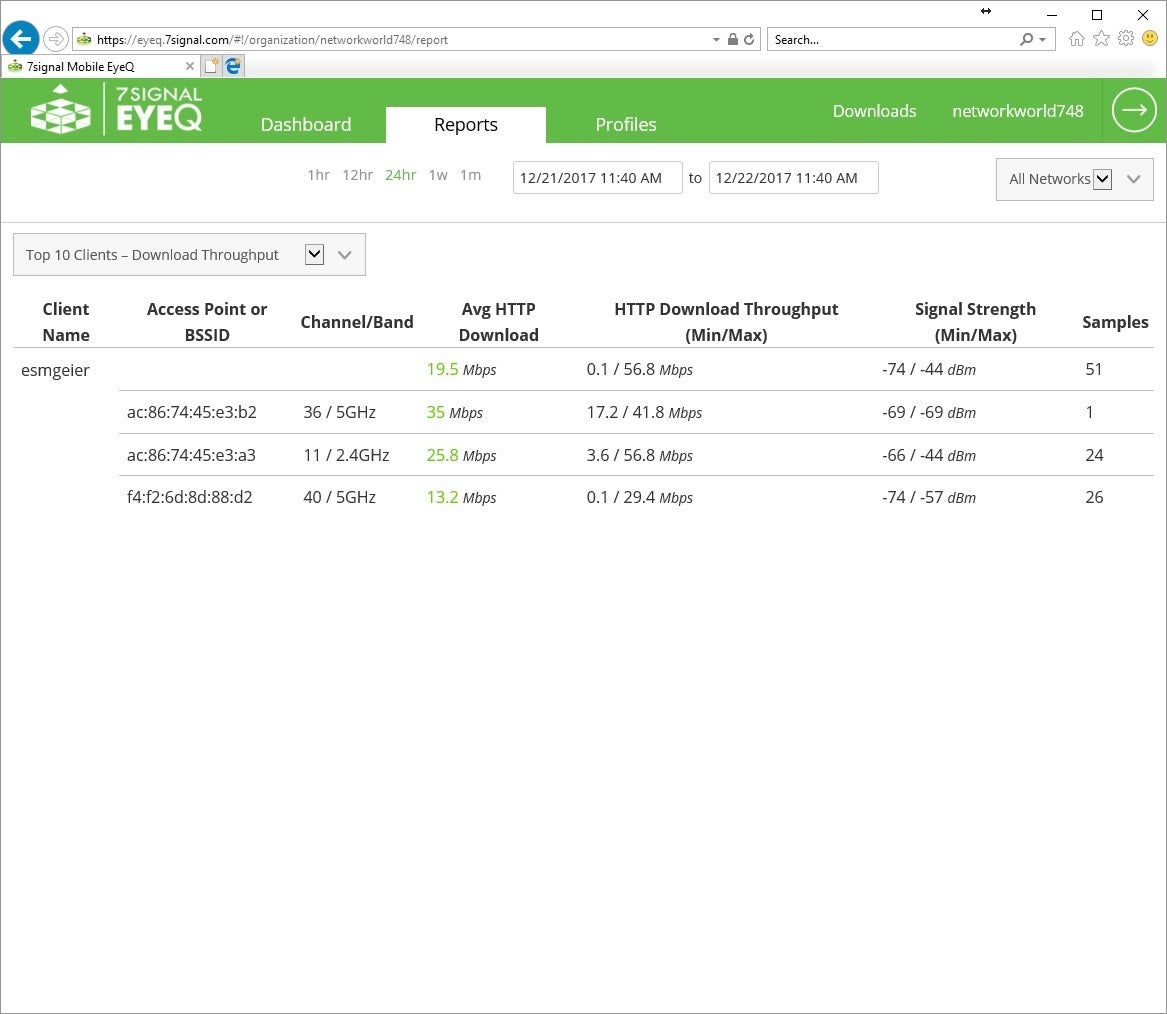 Eric Geier
The Reports of EyeQ are relatively simple and basic, showing a few pieces of data in a table format.
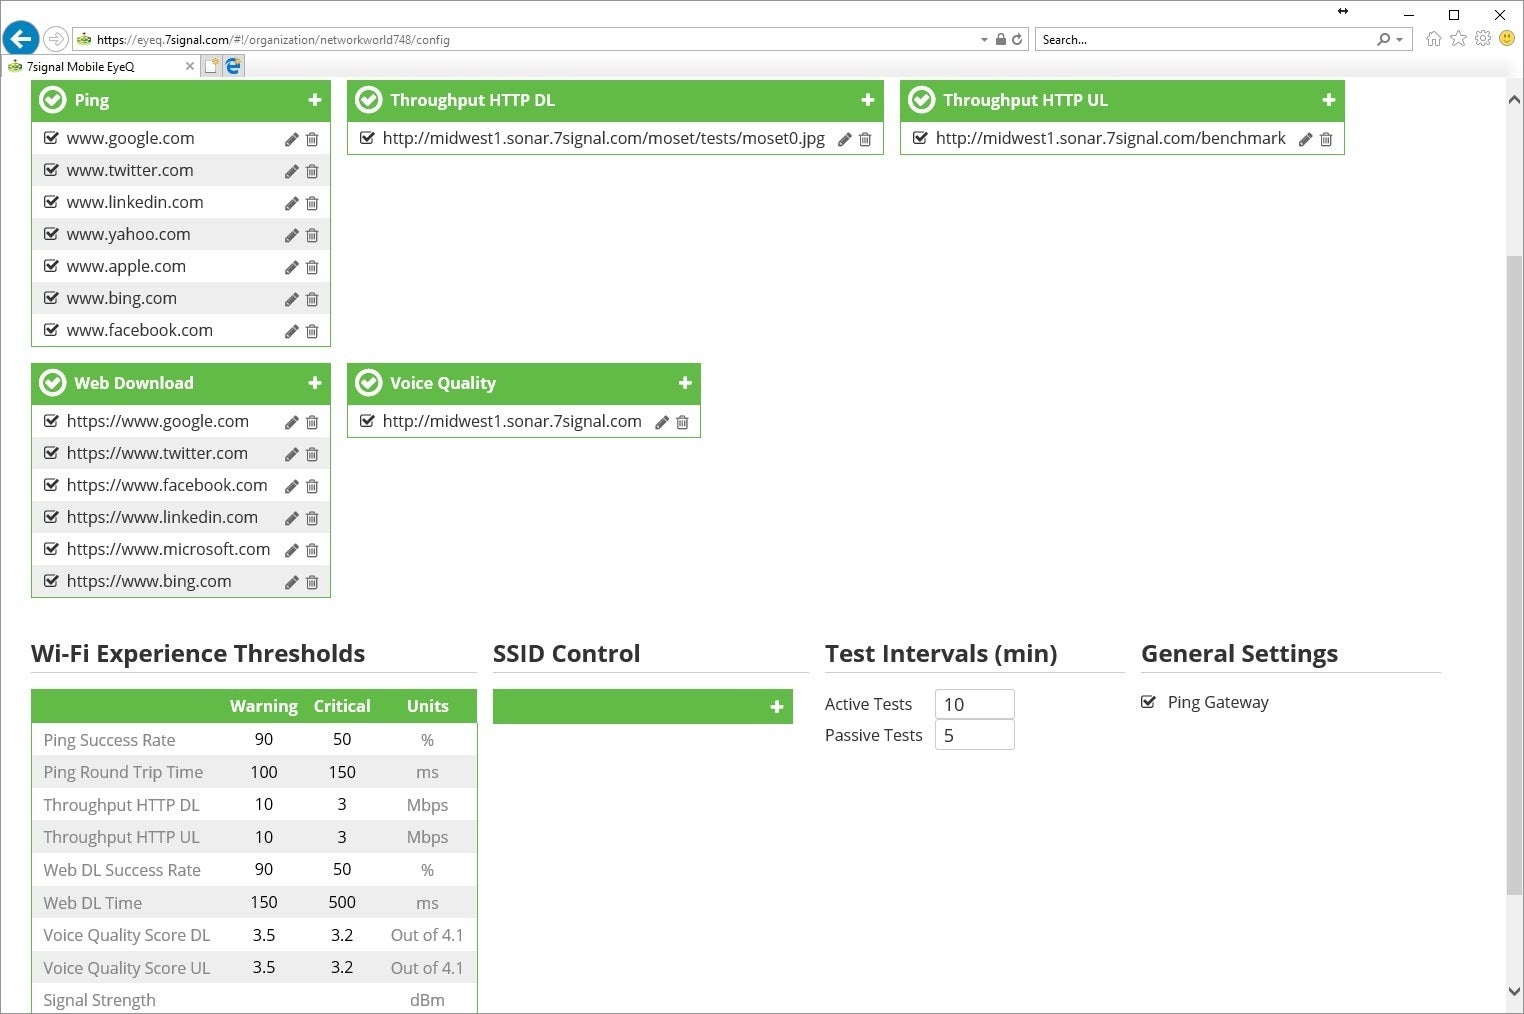
On the Profiles page, you can view and configure the test destinations and settings. We appreciate that it’s loaded with generic defaults so you have something up and running from the start. For the most part, the settings were easy to understand and modify.
 Eric Geier
The Profiles page of EyeQ is where you can manage the testing configurations.
Overall, we found the EyeQ monitoring platform to be simple and basic. This is good in regardless to user-friendliness, but we were hoping for a bit more advanced functionality. One major advantage of this platform over the other sensor solutions we reviewed is that you can easily employ existing computers and mobile devices as sensors, and aren’t required to purchase and deploy their hardware.
NetBeez Wi-Fi Monitor
The NetBeez Wi-Fi Monitor is another sensor product that you deploy throughout a Wi-Fi network for remote monitoring and troubleshooting. It’s priced at $180 per sensor. They offer a cloud-based dashboard like the other similar services here, but NetBeez only offers it free if using only one sensor or agent. Pricing for the cloud service starts at $310 per month for up to 5 Wi-Fi and/or wired sensors or agents.
In addition to the Wi-Fi sensor we evaluated, they also offer sensors for the wired network: a fast ethernet option and gigabit ethernet option. Plus they offer various software-based agent packages designed for GNU/Linux, Raspberry Pi, cloud, and virtualization deployments.
 NetBeez
The NetBeez Wi-Fi sensor looks more like a home-made unit compared to the two other sensors we reviewed.
The Wi-Fi sensor consists of a main unit which has a Raspberry Pi inside, powered by the included Micro USB power adapter. The unit is black and just over 1 inch tall, 2½ inches wide and about 3½ inches long. Plus there’s a typical ASUS dual-band wireless adapter (USB-AC56) plugged into one of the USB ports, adding about 4 inches to the length of the entire unit, plus a 5 ½ inch antenna. The other USB ports can be used for resetting the device.
On the back, there’s an Ethernet port to perform monitoring on the wide side as well. Unfortunately, it doesn’t support PoE without the use of an additional Micro USB PoE adapter. On the side of the device, there’s an HDMI port, which can be used for debugging and troubleshooting. There’s also an audio port, which provides no functionality.
We reviewed the Wi-Fi sensor with software version of 1.2.0 and the cloud dashboard version 1.2.1. The first time logging into the dashboard we saw a welcome message with a link to their Guide.
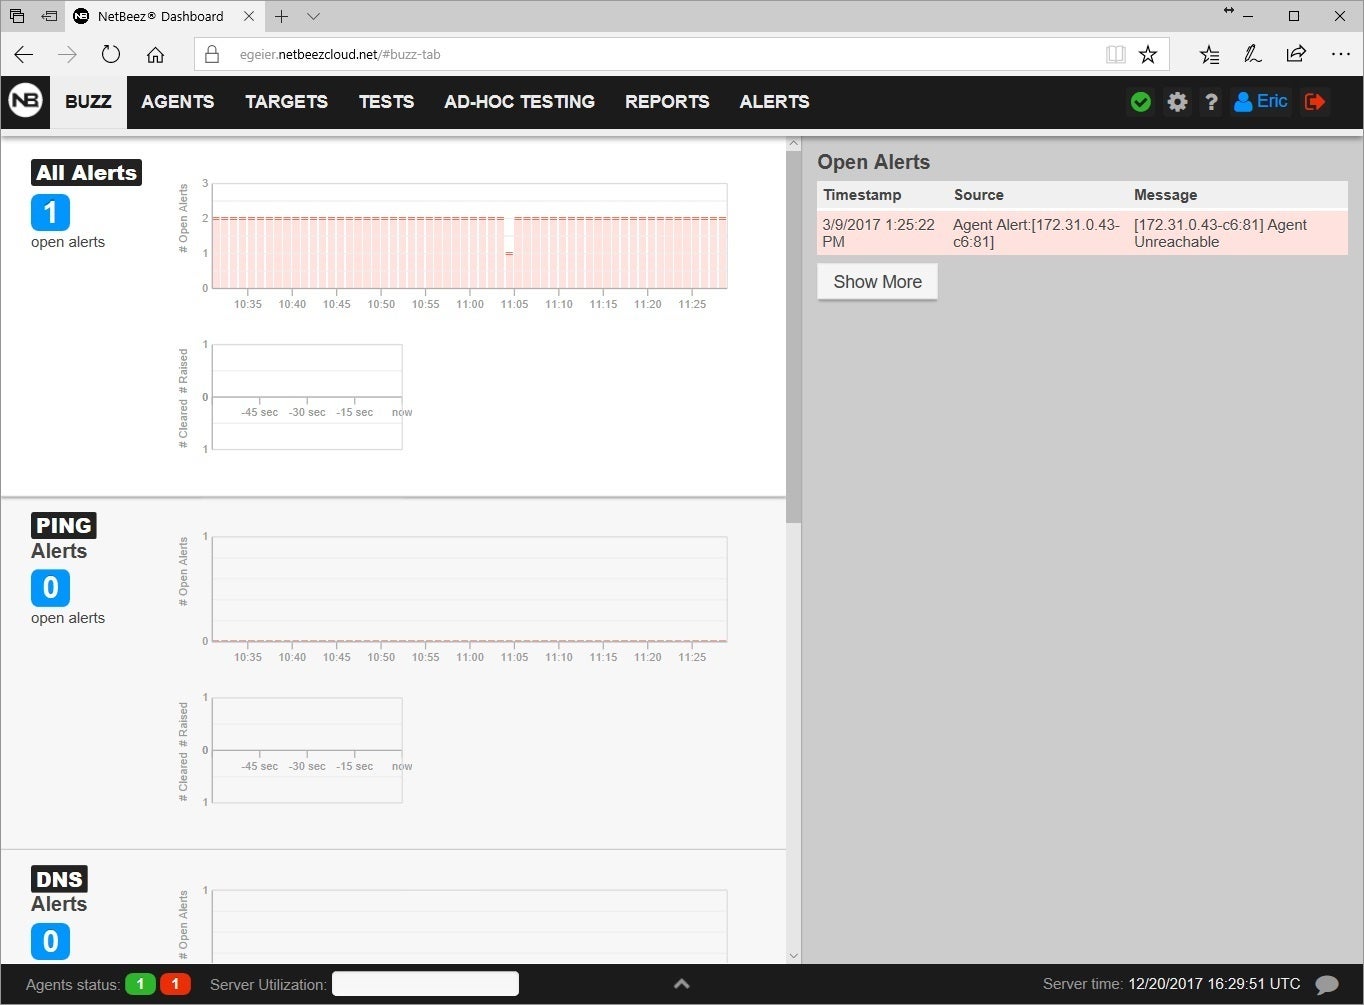
On the Buzz tab, you see an overview of the alerts and associated graphs. The graphs are a good start, but we were disappointed that we couldn’t easily adjust the time frame displayed. Additionally, we didn’t find an apparent way to ignore/delete alerts, which would be useful.
 Eric Geier
The Buzz tab is where you see an overview of any alerts.
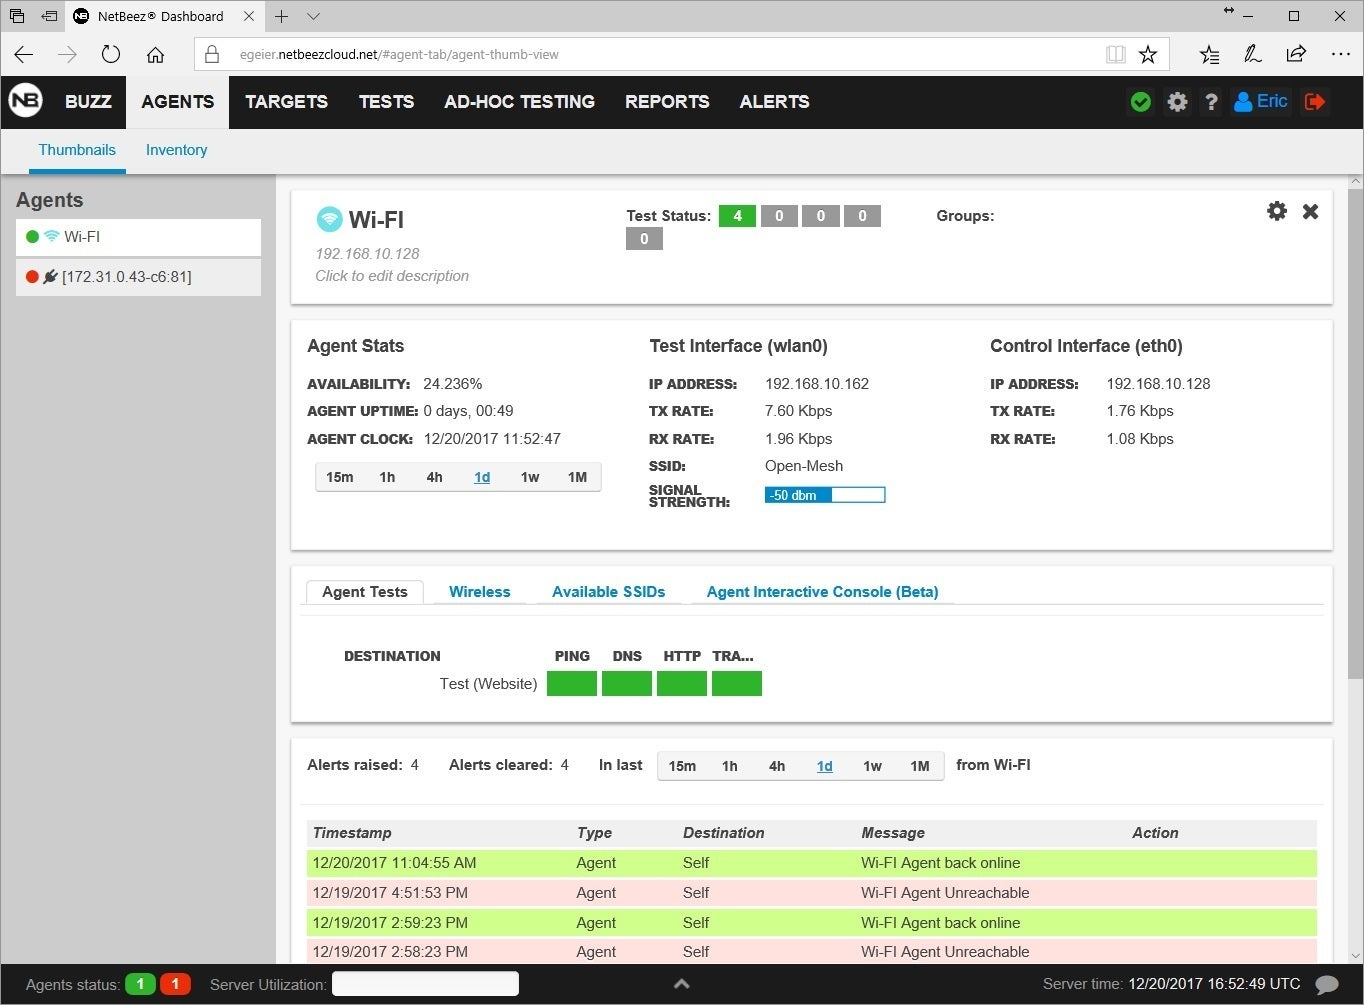
On the Agents tab you can see an overview of the status and alerts per agent in an inventory list or thumbnail view. On the inventory list view, we liked how you can click the agent name to easily edit the name, but didn’t find a way to open the agent page to view all the details. On the thumbnail view, you can however click a thumbnail to open that agent’s page. Different views can be useful, but in this case it doesn’t seem well thought out.
 Eric Geier
On an agent’s page, you can view it’s statuses, graphs and settings.
On the Targets tab, you can view and manage the targets and settings of the ping, DNS, HTTP and traceroute tests. And the Tests tab is where you view results of those tests, plus configure iperf, VoIP and speed tests. You can also run one-off tests via the Ad-hoc Testing tab.
 Eric Geier
Example of configuring a ping, DNS, HTTP, and traceroute tests against a website.
On the Reports tab you can generate reports for network, agent, target and scheduled test statuses, all exportable to a PDF. On the Alerts tab, you simply see a listing of all alerts.
In the upper-right of the dashboard you can access the Settings page. There you can configure data retention, integrations, email reports and other server settings. You can also configure the alert profiles and methods - SMTP, SNMP and syslog. In the upper-right of the dashboard you can also access the help menu, which takes you their online documentation.
Overall, the Netbeez Wi-Fi sensor is a good monitoring tool, but it’s GUI can certainly be fleshed out to be more user-friendly. It took us a while to figure out how to connect it to a Wi-Fi network, for instance, which seemed to require many more clicks than it should. The home-made design with the Raspberry Pi doesn’t provide an enterprise look and feel like other sensors, but some may appreciate the software deployment flexibility NetBeez provides. This solution is the only one reviewed here that supports wired monitoring as well.
WiFi Pineapple Tetra
The WiFi Pineapple Tetra is a dual-band Wi-Fi auditing and penetration-testing device. It looks similar to a typical access point (AP) but is loaded with a custom OS, called PineAP. It contains penetration testing tools for Wi-Fi reconnaissance, man-in-the-middle, tracking, logging and reporting. Its main function is to imitate APs and trick clients into connecting to it, which then allows you to perform further penetration testing and ethical hacking.
 WiFi Pineapple
The WiFi Pineapple Tetra at a glance looks like an ordinary wireless router or AP.
We evaluated the TETRA Basic edition, priced at $199.99. The unit has a black plastic exterior and is about 5½ inches wide, 1 inch tall, and 4½ inches long. It also has four detachable antennas measuring about 7 inches long. On the front of the unit are three status lights. On the back is the power button, power input for the AC wall adapter, two micro USB ports, a full USB port, and an ethernet port. Along with the TETRA Basic edition comes a USB Y-Cable, wall AC power adapter, and a Quick Start Guide.
After powering the device on for the first time, you must complete the initial setup. This involves uploading the latest firmware, setting a root password and optionally setting up Wi-Fi access to the device. After that, you’ll see the Dashboard when logging into the web GUI.
 Eric Geier
The Dashboard of WiFi Pineapple shows the mains stats.
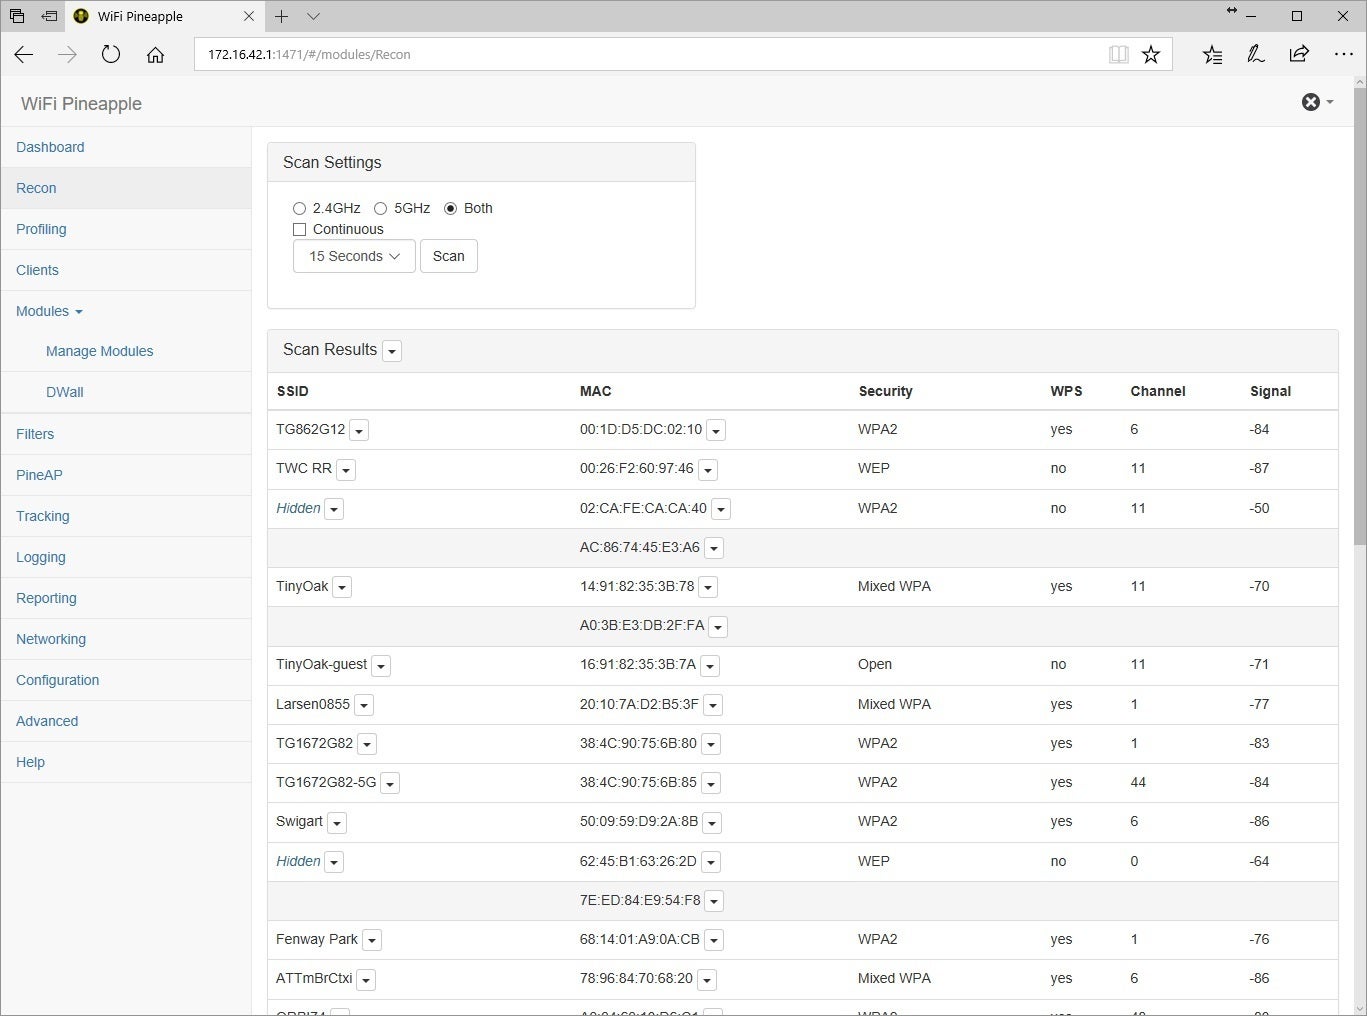
On the left menu, you can click through the different pages. The Recon page allows you to scan for APs and clients and then add those you want to the lists for profiling or to the PineAP pool or filter. You can also send de-authentication frames to clients that you want to kick off the network they’re currently connected to. The AP and client list shows the basic network details, but we wish it was possible to filter or sort the list, for instance, by the signal level.
 Eric Geier
The Recon page of WiFi Pineapple is where you can initiate the scanning of Wi-Fi APs and clients and view their details.
On the Clients page, you’ll see a list of details for the clients that are currently connected to the WiFi Pineapple. This includes the MAC and IP address, host name of device, which can help identify the type of device, and the spoofed SSID to which the clients are connected. You can optionally kick clients off the WiFi Pineapple, or add MAC addresses or SSIDs to the pools, filters, or tracking lists.
On the Modules page, you can add additional tools and functions, such as for man-in-the-middle attacks. There are currently more than two dozen different modules. Examples include a feature to show a stream of web browsing data and images from connected clients and a DNS spoofer to forge replies to DNS queries.
On the Filters page, you can list clients and SSIDs that you want to explicitly deny or allow to connect to the WiFi Pineapple. On the PineAP page, you can configure the main SSID spoofing settings and view the SSID pool - the SSIDs with which the WiFi Pineapple will automatically spoof clients.
 Eric Geier
The PineAP page of WiFi Pineapple is where you configure some of the spoofing techniques.
On the Logging page, you can view a list of the logs that show probe requests broadcasted by clients and also associations and deassociations of clients to and from the WiFi Pineapple. Although the list is filterable, it would be nice if it were also sortable. On the Reporting page, you can configure the reports to be automatically stored or emailed, but it would be nice to also be able to generate a report right away.
On the Networking page, you can view the routing table of the WiFi Pineapple, configure the access point for the management and open AP functions. You also can configure the wireless-client function if you want to get the internet feed via a Wi-Fi network. On the Configuration page you can configure general device settings as well the HTML or PHP code for the landing page that clients would see when they connect to the WiFi Pineapple, if you indeed choose to enable the landing page.
There’s a Help page on the web GUI, which discusses most but not all of the pages and their features and settings. It would be even more helpful if some of these details were given throughout the GUI, such as by using tooltips. A wizard of some sort would also be handy to help in initially configuring the device and maybe wizards for configuring certain attacks.
Overall, the WiFi Pineapple Tetra is a really neat and unique tool that could certainly aid in penetration testing and learning more about Wi-Fi security. There is a learning curve to understand exactly how to use the tool, some of which could be eased if there were some improvements to the GUI process and documentation.